
53% of mobile site visitors leave if a page takes more than 3 seconds to load. And once they're gone, they don't come back – they go to your competitor. The problem? Most SME owners don't see it, because the site "works". Working isn't converting.
The 4 Reasons Your Site Loses Customers Every Day
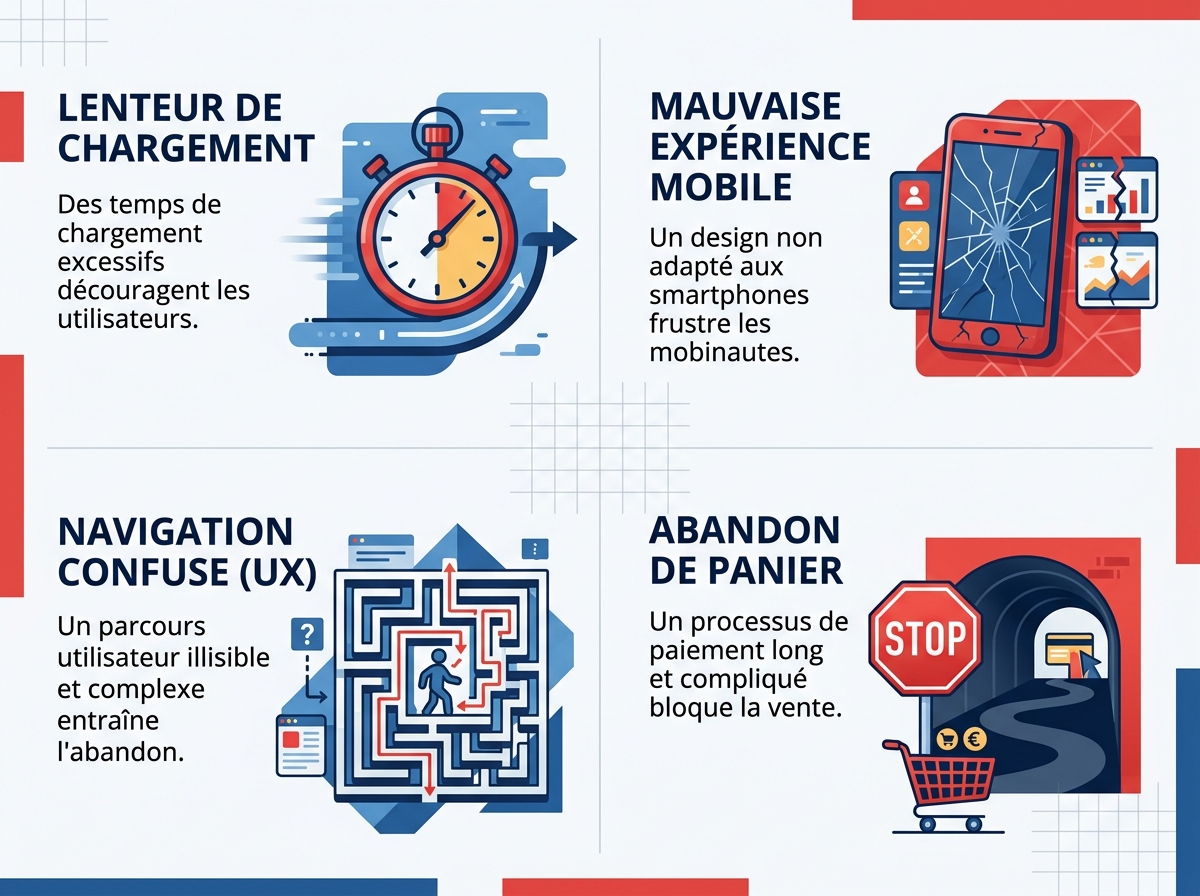
A site that fails to attract or convert rarely has just one flaw. It's almost always a combination of four overlapping problems: slowness, mobile incompatibility, a confusing user experience, and an overly complex purchase funnel.
Slowness: Every Second Literally Counts
The 3-second rule is a measured fact, not a metaphor. According to data compiled by Akamai, every additional second of loading time reduces your conversions by 7%. Between 1 and 5 seconds, the abandonment rate reaches 90%. The top 10 Google results load in less than 1.65 seconds on average (source: 6tematik).
In concrete terms: if your online shop takes 5 seconds to display and generates €10,000 in monthly revenue, you are potentially losing several thousand euros each month – without even realising it.
Mobile-first: Over 74% of Transactions, Yet Still Unsuitable Sites
In 2024, 74% of global e-commerce transactions were made from a smartphone (source: FEVAD / Payplug-Prestashop 2025). Google now indexes your site mobile-first – this is the principle of Mobile-First Indexing. An illegible menu on a small screen, buttons that are too close together, or unresized images: these are all friction points that drive visitors away.
Testing your site on an old, entry-level Android with a standard 4G connection is often more revealing than a desktop test on fibre.
User Experience: A Lost Visitor Doesn't Ask for Directions
User experience (UX) refers to the ease with which a visitor navigates, understands your offer, and takes action. A visitor who can't find your phone number in less than 5 seconds doesn't search – they leave. The most common red flags:
- Overloaded menus or menus structured according to your internal logic (not the customer's)
- Absence of clear calls to action (CTAs): no "Book an appointment", "Request a quote", "Buy" button
- Homepage that presents the company rather than the value provided to the customer
- Contact forms with 12 fields when 4 would suffice
In practice, we regularly see SMEs with excellent products but a website where the value proposition only appears at the bottom of the page. Result: a bounce rate exceeding 70%.
Overly Long Purchase Funnel: Abandoned Cart Is a Symptom
The average e-commerce cart abandonment rate hovers around 70% (Baymard Institute). A large part of this is explained by an overly tedious checkout process: mandatory account creation, redundant forms, lack of alternative payment options.
A concrete case published by Payplug: the Saeve brand reduced its payment phase bounce rate by 20% simply by adding visible security guarantees and split payments. This isn't a complete redesign – it's a targeted adjustment based on data analysis.
How to Diagnose the Real Obstacles on Your Site
Before completely rewriting your site, identify precisely what's going wrong. Three free tools can already provide a reliable dashboard:
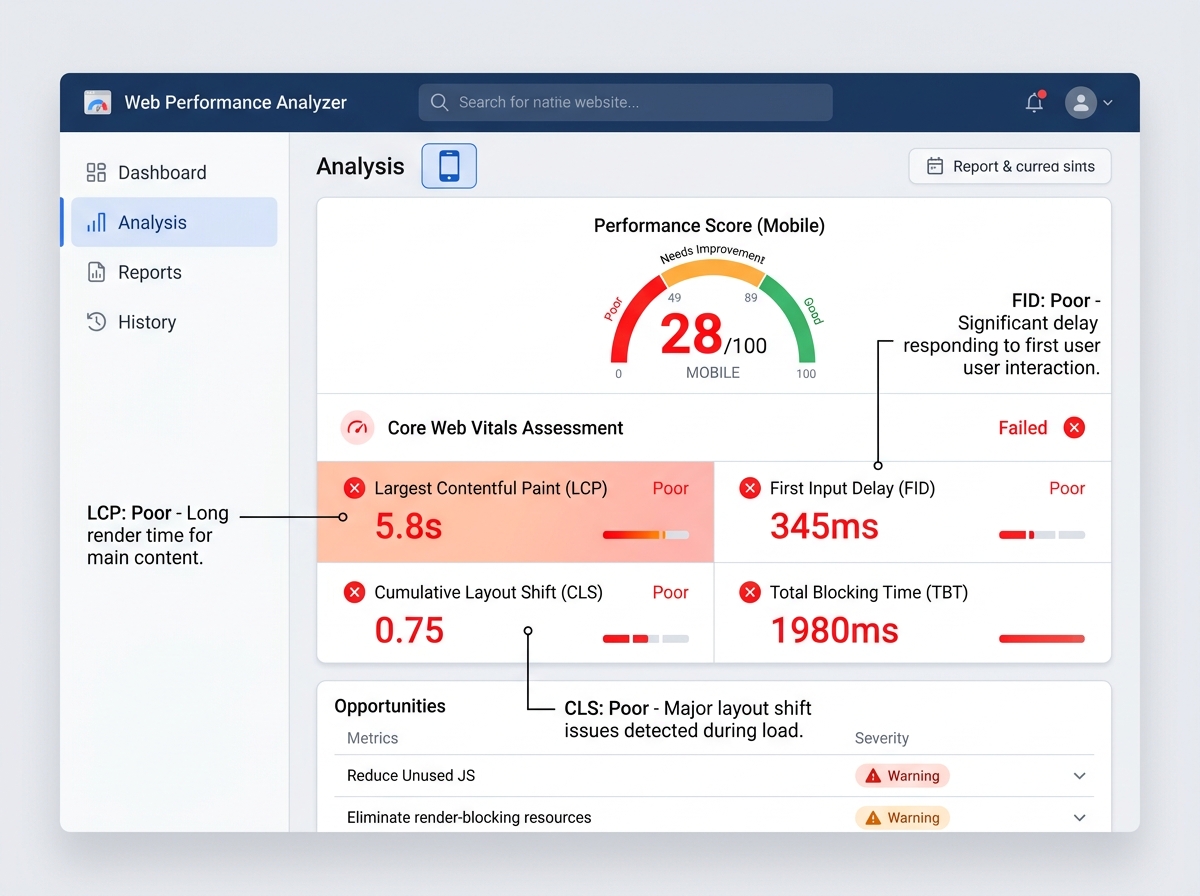
- Google PageSpeed Insights: measures speed on mobile and desktop, identifies the most impactful problems (LCP, CLS, FID – the Core Web Vitals)
- Google Search Console: flags pages with indexing and mobile experience issues
- Hotjar or Microsoft Clarity (free version): records real user sessions and maps clicks – you'll see exactly where visitors drop off
These tools provide raw data. Interpreting them and prioritising corrections requires experience: a structured technical SEO audit helps avoid fixing the symptom rather than the cause.
The 5 Priority Fixes to Apply Right Now

No need to start from scratch. Most performance gains are achieved with five targeted actions:
- Compress and convert images to WebP format (30 to 50% page weight reduction without visible quality loss)
- Enable browser caching and a CDN (Content Delivery Network) to distribute resources closer to the user
- Reduce superfluous third-party scripts: every plugin added to WordPress or every marketing tracker slows down loading
- Switch to high-performance SSD hosting: low-end shared hosting is often the primary culprit for a high TTFB
- Simplify contact forms and CTAs: a visible button, a clear message, only one action requested per page
On the projects we support, these five corrections alone generally allow a PageSpeed score to go from 35-45 to 70-85 in a few weeks – without a complete redesign.
SEO and Performance: A Virtuous (or Vicious) Circle
Slowness and poor UX don't just annoy your visitors. They signal to Google that your site doesn't offer a good experience. Core Web Vitals – LCP (main content display speed), INP (interactivity responsiveness), and CLS (visual stability) – have been official ranking criteria since 2021.
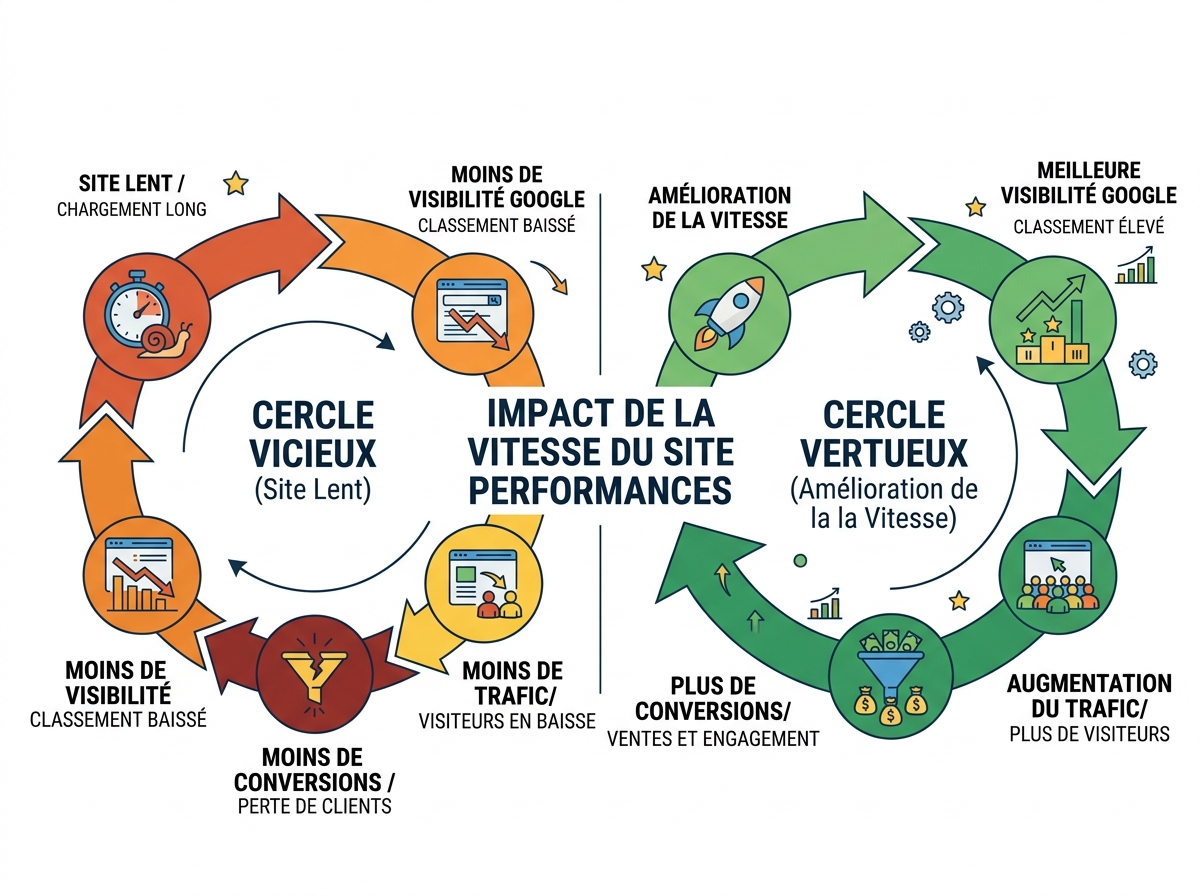
A slow and poorly structured site receives less organic traffic, which mechanically reduces conversion opportunities. It's a vicious circle: poor performance → less visibility → fewer leads → less revenue. The opposite is also true.
To delve deeper into this aspect, the technical SEO audit allows you to map all the technical blockages that penalise your ranking.
What Your Site Tells Google and AI Agents About You

By 2026, your site will no longer just be talking to humans. AI engines – ChatGPT, Gemini, Perplexity – read your content to answer your future customers' queries. A poorly structured site, without semantic markup, without clear and hierarchical content, is simply not citable by these systems.
This is the GEO (Generative Engine Optimization) pillar: being visible not only on Google but also in AI-generated responses. An SME that optimises its site correctly today gains a real advantage over those that wait.
A 360° visibility audit allows you to simultaneously evaluate technical performance, SEO positioning, and presence in AI responses – to get a complete picture of what your future customer sees (or doesn't see).
Where to Start Concretely?
The good news: you don't have to start from scratch. In most cases, an accurate diagnosis reveals 3 to 5 friction points that account for 80% of losses. Correcting them as a priority produces a rapid and measurable impact.
Recommended steps:
- Measure the existing: PageSpeed Insights + Search Console + behavioural analysis (Clarity)
- Prioritise corrections based on impact/effort: speed first, then mobile, UX and CTAs in parallel
- Set up monitoring: a simple dashboard (conversion rate, bounce rate per page, average time) to measure the effects of corrections
- Iterate: web optimisation is not a one-off project, it's a continuous process
If you're unsure exactly what's wrong with your site, a free audit can identify priority obstacles in less than 48 hours – with no obligation.