
Many SMEs publish, post, and send emails – without ever knowing if it yields any results. This isn't a lack of effort; it's a lack of measurement. Here's how to fix it.
Why most SMEs fly blind without instruments

According to FranceNum, 72% of French businesses claim to have an online presence – but how many actually know if this presence brings them customers? The answer is far lower.
The problem isn't a lack of tools. Google Analytics is free, and social media dashboards are integrated. The problem is knowing what to look at and how to interpret what you see. An SME that only tracks its Instagram followers or number of visits is flying blind: it confuses activity with results.
Without structured measurement, you won't know:
- if your audience finds you at the right time (visibility vs. purchase intent)
- if your messages grab attention or are ignored
- if your visitors remain curious or leave after 10 seconds
- and most importantly, if your communication budget generates a concrete return
Bounce rate: does your content truly match the visitor's intent?
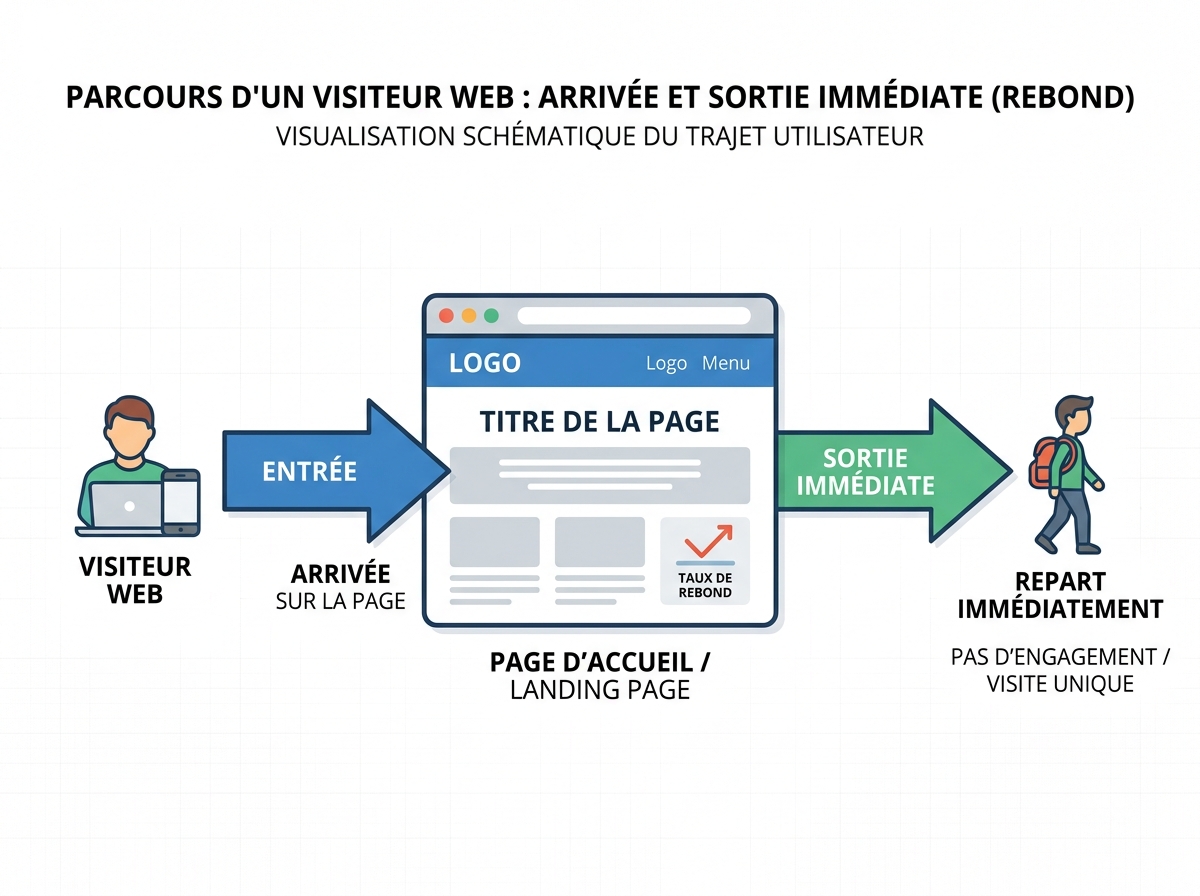
The bounce rate is the percentage of visitors who leave your site after viewing only one page, without any interaction. It's one of the first warning signs of communication disconnected from its audience.
A high bounce rate can indicate several things:
- The content doesn't match what the visitor was looking for (poor SEO or advertising targeting)
- The page loads too slowly (each extra second increases the bounce rate by ~20% according to Google)
- The mobile experience is degraded (over 60% of web traffic will be mobile in 2025)
- The message is too generic and doesn't directly address the visitor's problem
In practice, benchmarks vary by sector. An informative blog might show 65-75% without alarm; an e-commerce site or service page above 55% warrants investigation. What matters is the trend and consistency with your context, not an absolute figure.
Good practical tip: Identify your 3 highest bounce rate pages, check if the page title matches the actual content, and measure loading speed with PageSpeed Insights. Often, 2 technical fixes are enough to gain 10 points.
Visit duration and pages per session: engagement can be measured
The average visit duration reveals whether your content engages or bores. A visitor who spends 30 seconds on your services page hasn't had time to understand your offer, let alone trust you.
Two complementary metrics to monitor together:
- Average session duration: ideally over 2 minutes for a showcase site, more than 3 minutes for a blog or detailed service page.
- Pages per session: a visitor who views 3 or more pages is actively searching. Below 1.5, navigation is broken somewhere.
These two indicators combined provide an accurate picture of the user experience. A business consulting SME recently discovered that its visitors spent an average of 45 seconds on its "Our Expertise" page – yet it was the most carefully crafted page on the site. The culprit identified: an unreadable mobile layout. After a redesign, the duration increased to 2 min 40, and contact requests doubled in 6 weeks.
Traffic vs. conversion: the metric that separates noise from signal
Attracting traffic costs energy, sometimes money. Converting it into a customer is where the true ROI of your digital communication lies.
The conversion rate is simply calculated: number of target actions (form filled, call initiated, purchase completed) divided by the number of visitors, multiplied by 100. An average conversion rate for an SME service site is between 1 and 3% (source: Wordstream). Below 1%, the problem is often in the value proposition or the clarity of calls to action.
Distribute your conversions by traffic source:
Source | Traffic | Conversions | Rate |
|---|---|---|---|
Organic SEO | 1,200 | 18 | 1.5% |
Google Ads | 400 | 14 | 3.5% |
Social media | 600 | 3 | 0.5% |
Direct | 300 | 9 | 3% |
In this fictional but representative example, social media generates traffic but very few conversions. Result: reallocating part of the social content budget to SEO or Ads can triple ROI without increasing the total budget.
Complementary KPIs not to ignore
Beyond the trio of bounce rate / visit duration / conversion, several indicators refine the diagnosis:
- Click-through rate (CTR) on your CTAs: if your "Request a quote" button is only clicked by 0.5% of visitors to the relevant page, the problem lies with the message or placement.
- Email open rate: a rate below 20% on your email campaigns (Mailchimp/Brevo benchmark for the services sector: 22-28%) indicates a problem with the subject, frequency, or list relevance. Note: these tools measure your emails, but they don't tell you why your subscribers disengage or how to improve your overall visibility.
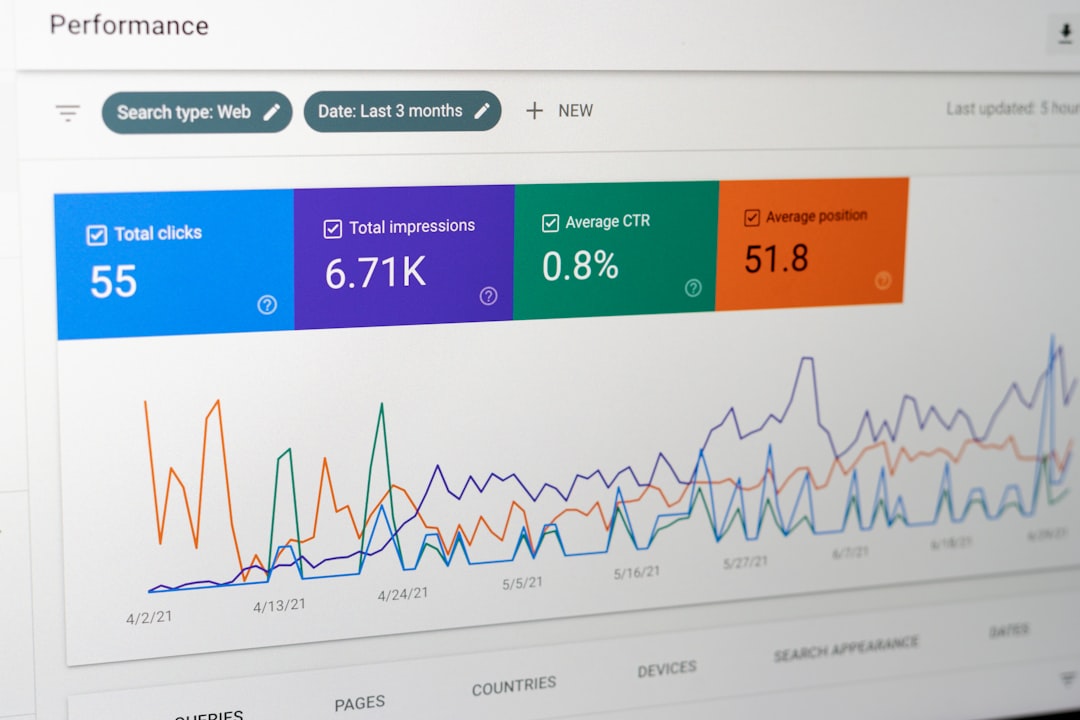
- Average position and SEO impressions: in Google Search Console, an average position between 8 and 15 with a low CTR indicates a title or meta description that needs to be reworked before any advertising investment.
- AI mentions and citations: at a time when ChatGPT, Gemini, or Perplexity directly answer internet users' questions, being cited by these agents becomes a visibility indicator in its own right. An SME not cited in AI responses in its sector loses a growing share of demand without even seeing it in its Google Analytics stats.
Measuring isn't enough: interpret to act
This is the classic trap: dashboards full of curves, but no decisions resulting from them. The popular Google Analytics 4 tool – or specialised platforms like Semrush – display hundreds of metrics. But GA4 requires advanced configuration for its data to be reliable (conversion events, internal traffic exclusion, multi-touch attribution). And Semrush, designed for expert SEO teams or large organisations, can quickly discourage an SME without a dedicated specialist.
The true value of a measurement is the decision it enables:
- See clearly what works and what blocks
- Correct priority friction points (technical, message, targeting)
- Prove results to invest with confidence
This See → Fix → Prove triptych is exactly the logic of a 360° visibility audit: it doesn't just show you your figures; it tells you what they mean and what to do first.
What Digitalyser offers that tools alone don't
Digitalyser is designed for SMEs and VSEs that don't have an in-house marketing team – not for experts who already know how to read a multi-channel attribution funnel.
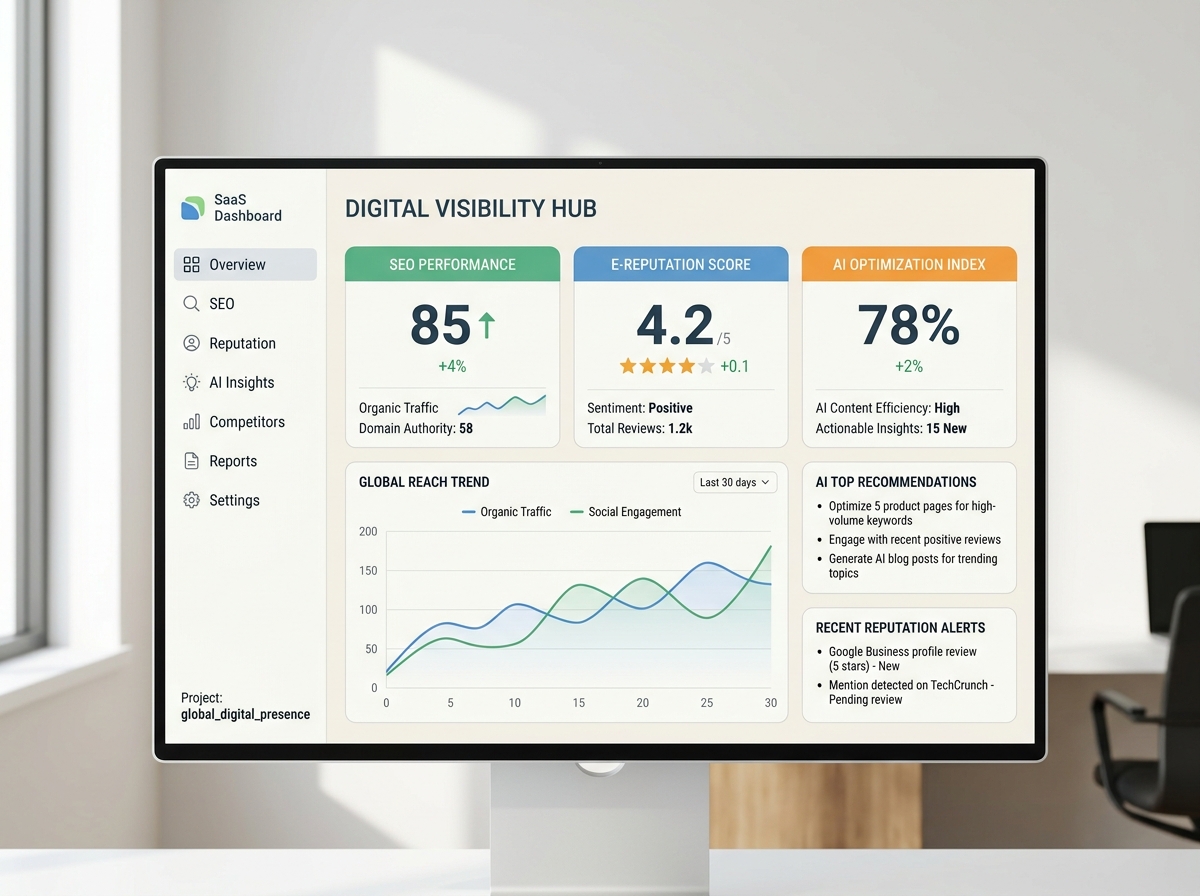
Specifically, the platform:
- Centralises key indicators (local visibility, SEO, e-reputation, AI presence) in a single, readable dashboard
- Automatically identifies blocking points and prioritises them by potential impact
- Tracks your visibility in AI engines (ChatGPT, Gemini, Perplexity) – a dimension that traditional tools still ignore
- Proposes concrete actions, not reports to interpret alone
If your digital communication generates traffic without conversion, or if you publish regularly without seeing measurable returns, the question isn't to work harder. It's to look at the right indicators, in the right place.
A free visibility audit provides a solid foundation: knowing exactly where you stand before deciding where to invest. And if you want to understand all available levers, the Digitalyser service offering covers the entire funnel – from visibility to conversion.