

Most “it worked” claims prove nothing. Here is how to establish that a correction produced an effect — and how to recognise the cases where no conclusion is possible, which is an answer in itself.
Why “it worked” almost never proves anything
Three months after a visibility project, someone always ends up asking: did it help? The honest answer is often “we don’t know”, and not because the work was poor. It is because nothing was set up to make a conclusion possible.
The problem is structural. Visibility moves on its own: seasonality, an algorithm update, a competitor making a move, someone else’s ad campaign.
Against that moving background, noting that a number went up after a correction demonstrates nothing — it might have gone up without it.
Establishing a link takes three precautions, and all three are taken before, not after.
Precaution 1 — the baseline measurement

It is taken before the first change, and it is unrecoverable once the changes have gone through. This is the most common mistake and the most final: you fix first, you think about measuring afterwards, and the prior state no longer exists anywhere.
A good baseline is not a single number taken on a given day. It is an average over a period long enough to absorb the noise — four weeks suits most cases — together with its spread.
Knowing that the number swung between 40 and 60 before the correction changes everything: a value of 65 afterwards is arguable, a value of 120 is not.
What a baseline measurement must contain
- The period covered, stated plainly, and its length
- The average value, and the spread between the lowest and highest observed
- The exact date of the correction, written down in advance
- What else changed during the period — on your side and in the market
- The planned observation window, fixed before the result is known
Precaution 2 — one variable at a time
This is the most expensive one to respect, because it contradicts the natural urge to fix everything at once, and because it slows you down. But if you complete the business profile, rewrite three pages and launch a review campaign in the same month, you may well learn that something worked — you will never learn what to repeat for the next client.
When the schedule leaves no room to wait, there is a middle path: space the corrections two to three weeks apart and write down each date. You lose some rigour, you keep a chance of attributing.
Precaution 3 — the observation window
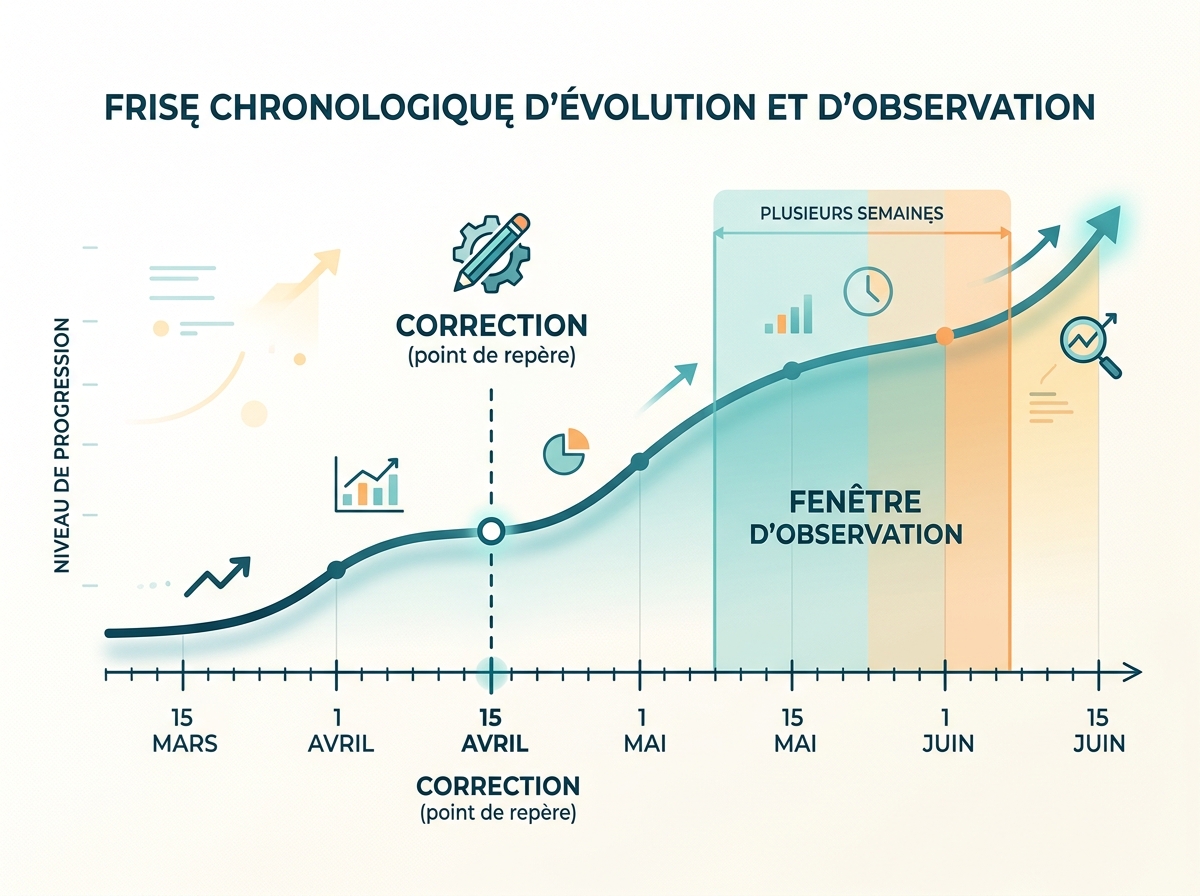
It is set before the result is known — otherwise the temptation is irresistible to stop measuring at the moment the curve looks flattering. Latencies differ a great deal depending on what was corrected.
- Technical indexing fix: a few days to two weeks
- Business profile completed or corrected: two to four weeks
- Bringing directory listings into line: four to eight weeks
- Review collection restarted: gradual effect, judge over a quarter
- Content work: a quarter, rarely less
- Citation by AI assistants: several weeks, read as a frequency and never as yes or no
Choosing the right indicator

The temptation is to follow the most flattering number — impressions, for instance, which rise easily. Pick instead the indicator closest to the business: calls received, direction requests, forms submitted, quotes requested.
A doubling of impressions with not one extra call is useful information, but mostly it tells you the problem is somewhere else.
Knowing when to conclude “we can’t tell”
That is a legitimate answer, and infinitely more solid than an invented causality.
A consultant who says “the variation is still within the usual noise, we need another month” is more credible than one who attributes every rise to their own work.