Many SMEs measure their online visibility without ever linking a single figure to their turnover. The result: hours spent on dashboards that don't trigger any decisions. Here are the indicators that really make a difference.
Why most visibility KPIs are useless
A visibility KPI is only useful if it predicts or explains a variation in real demand. However, the majority of indicators tracked by SMEs are vanity metrics: they are pleasant to look at, but don't move the sales needle.
Classic examples to watch out for:
- The total number of visitors to the site (without segmentation by intent)
- The number of social media followers
- The average ranking across all keywords (all queries combined)
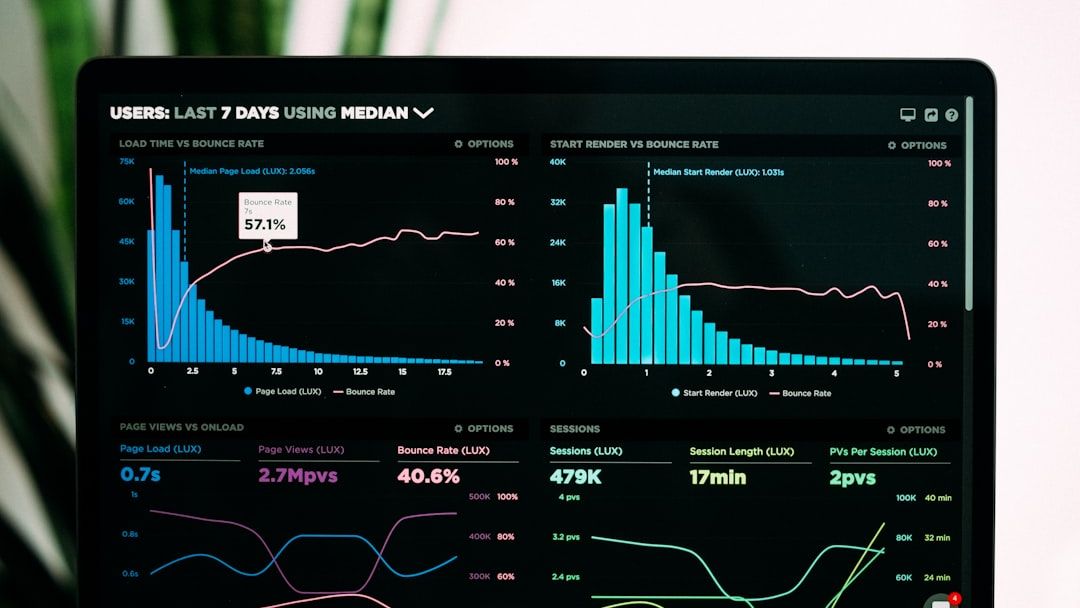
- The bounce rate in isolation, without page context
These figures can increase while your sales pipeline empties. The question is not "am I visible?" but "am I visible to the right people, at the right time, on the right channel?"
Business query positions: the first predictive signal

Business query positions are Google rankings for keywords that correspond to a direct purchase or contact intent. These are not generic queries ("what is SEO") but transactional and local queries ("emergency plumber Lyon 3rd", "SME invoicing software price").
Moving from position 8 to position 3 for a query with 500 searches/month can represent +200% clicks, according to Search Console CTR data. This is measurable, directly correlatable to purchase intent.
How to identify them?
- List your 10 to 20 queries that generate calls or filled forms
- Track their position week after week in Google Search Console
- Calculate the click-through rate (CTR) for these specific queries, not the site average
This is a 30-minute task to set up, but it advantageously replaces hours of useless reporting.
Local share of voice: your real weight in your local market

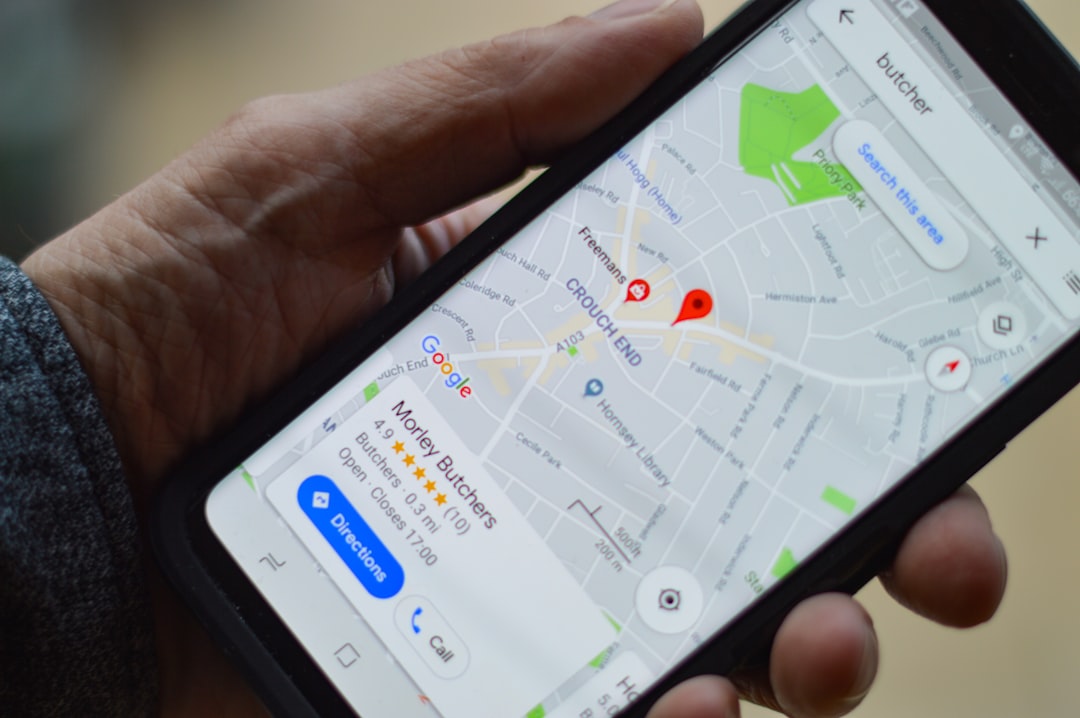
Local share of voice measures how often your establishment appears in the Google Local Pack (the 3 map results) for a set of geolocated queries relevant to your activity.
In concrete terms: if you are visible for 6 out of 10 local queries tested around your catchment area, your local share of voice is 60%. This is an indicator that tools like BrightLocal or Whitespark can calculate – but these platforms are often designed for agencies or large brands, with complex interfaces and pricing not well suited for VSEs/SMEs. The Digitalyser 360 visibility audit centralises this calculation in a dashboard designed for business leaders, with no learning curve.
A 10-point increase in local share of voice generally precedes an increase in inbound calls within 4 to 8 weeks. This is a leading indicator, not a lagging indicator.
Impressions and actions on your Google Business Profile listing
Your Google Business Profile listing is often the first point of contact between a prospect and your business – even before your website. The listing's native metrics are directly predictive:
- Impressions: how many times your listing appeared in the results (Maps + Search)
- Website clicks: strong intent signal
- Direct calls from the listing: immediate conversion, the KPI closest to turnover
- Directions requests: intent for a physical visit
- Messages: qualified engagement
According to Google data, complete and active listings receive on average 7 times more clicks than incomplete listings. Yet, less than one in three SMEs update their listing regularly (source: BrightLocal Local Consumer Review Survey 2025).
Track these figures monthly. A drop in impressions without a drop in site traffic can signal a listing problem (suspension, duplicate, incorrectly categorised) that needs urgent correction.
AI citations: the emerging KPI your competitors are still ignoring

Since 2025, a growing proportion of searches no longer end on a classic results page. ChatGPT, Perplexity, Google AI Overviews, and Gemini directly answer user questions – and cite (or not) businesses in their responses.
The AI citation frequency is the new entity notoriety KPI. It measures how often your brand, address, or expertise appear in the responses generated by these agents.
How to evaluate it concretely:
- Ask 10 to 15 questions to ChatGPT and Perplexity about your local business queries ("what is the best [your profession] in [your city]?")
- Note if your business is cited, and at what position
- Repeat monthly to track the trend
This is not yet an automated KPI for most SMEs, but it is an advanced entity reputation signal that foreshadows tomorrow's visibility. The Digitalyser semantic audit integrates this GEO dimension to identify areas for improvement.
Qualified traffic and conversions from SEO/local: the results KPIs
Qualified traffic is defined as sessions resulting from commercial or local intent queries, which lead to a measurable action (form, call, purchase, appointment booking). This is the direct translation of your visibility into real demand.
In Google Analytics 4, segment:
- Organic traffic by page type (product/service pages vs blog pages)
- Conversions by channel (SEO, Local/Maps, Direct)
- Conversion rate by traffic source
An organic traffic conversion rate below 1.5% on service pages often signals a problem with the match between the captured query and the page content – not a problem with traffic volume.
Field rule: if your organic traffic increases but your conversions stagnate, you are attracting the wrong people. Go back to your business queries and check the intent/page alignment.
How to set measurable goals and link visibility → sales
The causal chain is simple to model, but rarely formalised:
Visibility (positions, impressions, citations) → Demand (clicks, calls, visits) → Sales (conversions, turnover)
For each KPI, set a SMART goal for 90 days:
KPI | Example 90-day goal |
|---|---|
Business query position | Top 5 for 5 priority queries |
Local share of voice | Increase from 40% to 60% |
Calls from GBP | +30% vs previous quarter |
Qualified organic traffic | +25% sessions on service pages |
SEO conversion rate | Increase from 1.2% to 2% |
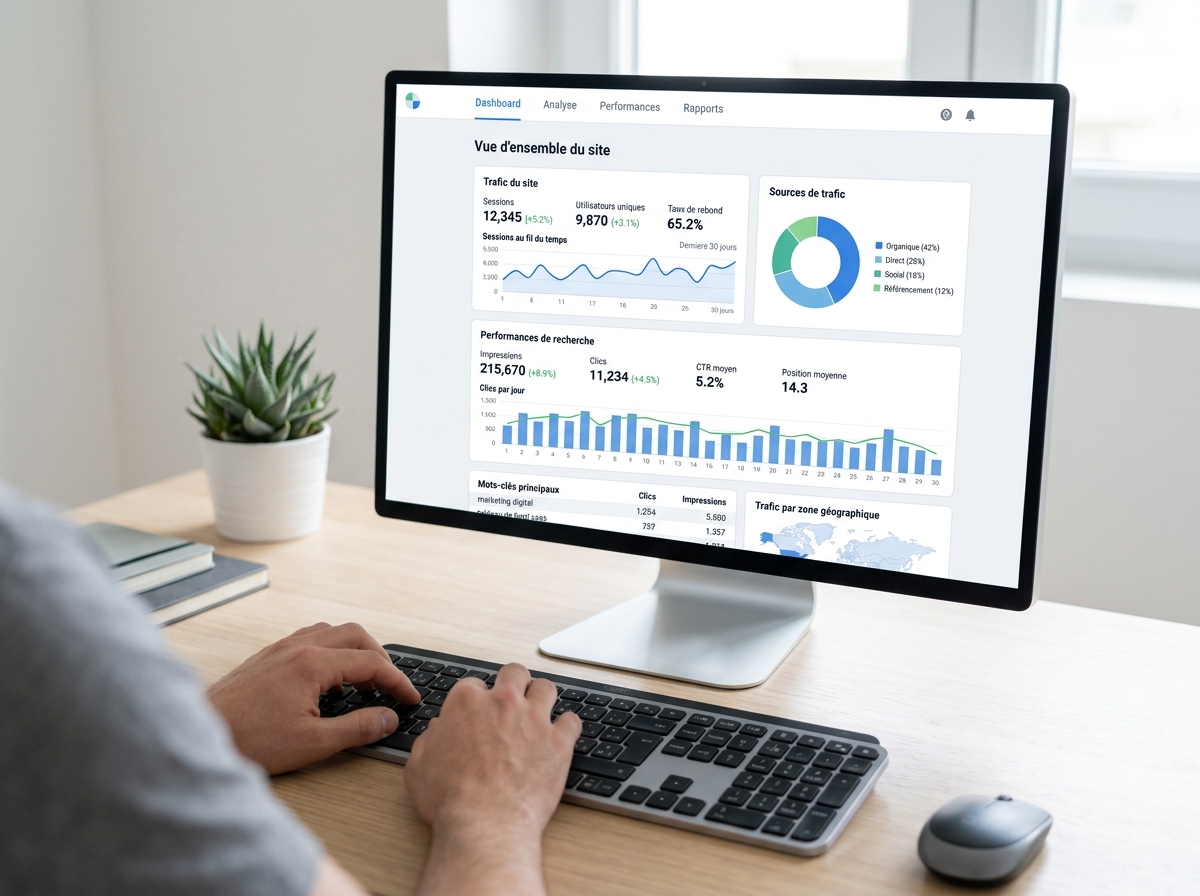
This dashboard fits on one page. It advantageously replaces 15 disparate indicators that tell no coherent story.
What you should stop measuring right now
Some metrics to remove from your weekly reports:
- The number of keywords ranked (without intent filter): an SME can be ranked for 2,000 queries without generating a single call
- Domain Authority / DR: useful for SEOs, not for business leaders; does not directly correlate with sales
- Total site traffic: prefer segmented qualified traffic
- Raw social media impressions: unless you measure the link with clicks to your site or contacts made
These indicators are not useless for an SEO expert who contextualises them – but they have no place in the dashboard of an SME leader who needs to make quick decisions.
Build your visibility dashboard in under an hour
You don't need a complex tool to get started. Here's a 4-step method:
- Identify your 10 priority business queries in Google Search Console (filter by service/product pages)
- Connect Google Business Profile Insights to a simple Google Sheets table
- Set up 2 to 3 conversion goals in GA4 (form, click on number, purchase)
- Launch a visibility audit to get a complete picture of your current situation, including local share of voice, GBP listing status, and AI entity signals
The free Digitalyser audit generates this dashboard in minutes, without any technical configuration. It identifies the most critical KPIs for your sector and geographical area, and tells you which ones to act on first to maximise impact on your sales.
Measuring the right thing at the right time is often more profitable than a new campaign. Start by knowing where you really stand.